The a2b computer program is designed to study bipartite ecological networks. Its merits are:
|
Computer
/ System |
Download |
Comments |
|
PC
Windows |
Self-extracting
file |
Double-click on autoa2b.exe. It
will expand in a user chosen directory |
After
installation, the a2b
In a bipartite network, 2 sets of nodes, here called A-species and B-species, are joined by interaction links.
For example, in a plant-pollinator network, pollinators are the
A-species, plants are the B-species, and links represent mutualistic
interactions between plants and pollinators (feeding of pollinators on
plants, plant gametes dispersal by pollinators). Other examples of
bipartite ecological networks are host-parasite antagonistic networks,
site-species biogeographical networks, plant-seed disperser mutualistic
networks, male-female mating networks.
A bipartite network comprising A-species in number A and B-species in number B, is
represented by a (0,1)-matrix M = (mab) that is rectangular of size AxB. The entry
mab = 1/0 of the matrix M indicates the
presence/absence of an interaction link
between the A-species a and the B-species b. A matrix W = (wab)
ascribing nonnegative weights
wab to interaction links can also be
introduced (A and W have the same nonzero entries). The matrix of weights represents biological values
associated with interactions,
e.g., number of visits of plants by pollinators.
With the a2b program,
several bipartite networks can be studied simultaneously, empirical ones,
specified in text files, or synthetic (random) ones, created using predefined
models. The networks can be edited and displayed graphically. Results are
stored in text and graphic files.
Network descriptors proposed by a2b program allow to analyze patterns and functionalities of a given ecological network via its topological properties, in particular
These 3 notions are crucial for the functionality of the network. They are related in non obvious ways.
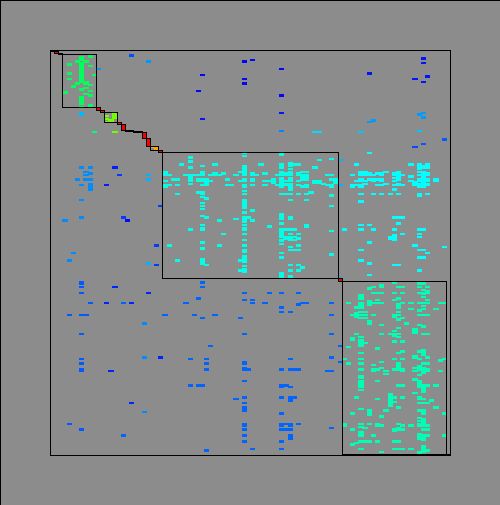
Decomposition of the Clements&Long_1923plant-pollinator network (A = 275 pollinator species, B = 96 plant species, L = 923 interaction links) into modules, represented by diagonal blocs in the (0,1)-matrix of the network.
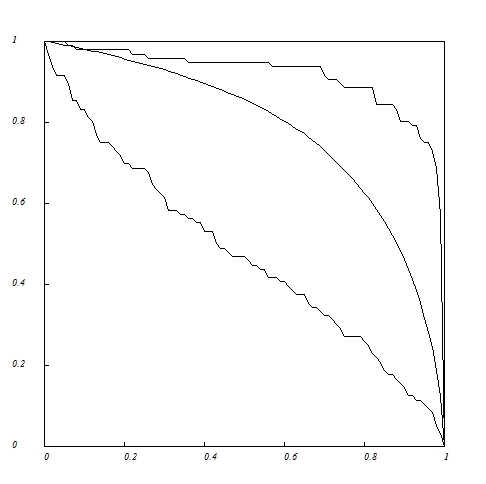
Robustness curves (tolerance to random extinction of pollinator species) for the Clements&Long_1923 plant-pollinator network.
Proportion
of deleted pollinator species in abscissa versus proportion of
remaining plant species in ordinates. (1) Lower curve, deletion
according to decreasing number of links. (2) Middle curve, random
deletion. (3) Upper curve, deletion according to increasing number of links.
Atmar W
& BD Patterson. 1993. The measure of order and disorder in the distribution
of species in fragmented habitat. Oecologia 96:373–382.
Brualdi RA
& JG Sanderson. 1999. Nested species subsets, gaps, and discrepancy.
Oecologia 119:256–264.
Brualdi RA.
2006. Algorithms for constructing (0,1)-matrices with prescribed row and column
sum vectors. Discrete Mathematics 306:3054–3062.
Memmott J, NM
Waser & MV Price. 2004. Tolerance of pollination networks to species
extinctions. Proceedings of the Royal
Society B 271:2605–2611.
Olesen JM, J Bascompte, YL Dupont & P
Jordano. 2007. The modularity of pollination
networks. Proceedings of the National
Staniczenko
PPA, JC Kopp &
Thébault E.
2013. Identifying compartments in presence–absence matrices and bipartite
networks: insights into modularity measures. Journal of Biogeography 40:759–768.
Thébault E &
C Fontaine. 2010. Stability of ecological
communities and the architecture of mutualistic and trophic networks. Science 329:853–856.
Elisa
Thébault, Colin Fontaine.