
The
|
Computer
/ System |
Download |
Comments |
|
PC
Windows |
Self-extracting
file |
Double-click on autonw.exe. It
will expand in a user chosen directory |
After
installation, the
A
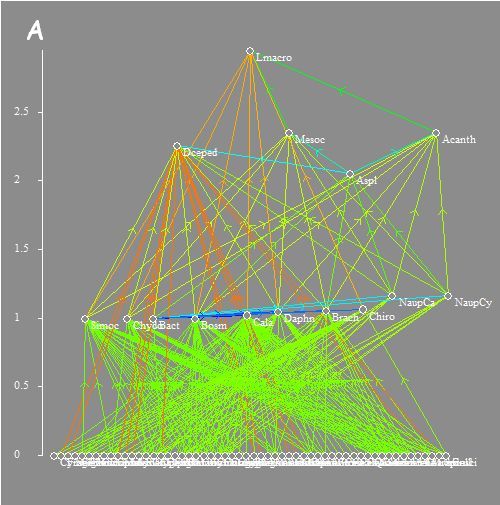
food web is a set of species related by trophic
interactions (who eats whom) within an ecosystem. A food web comprising
S species can be represented by a directed
graph or
network whose nodes
are the species and whose arcs describe the feeding links.
In the
network representing the food web, there is an arrow joining each prey
(resource) species to its predator (consumer) species.
A
food web can be
represented by a (0,1)-matrix A = (aij) of size
S,
where aij = 1/0 depending of the
presence/absence of a feeding link
between species i and species j. A matrix W = (wij)
ascribing non negative weights
wij to trophic links can also be
introduced (A and W have the same non
zero entries). The matrix of weights represents biological values
associated with trophic interactions, like energy flux, probability of capture, consumption rate.
With the
n_w
program, several food webs can be studied simultaneously, observed ones, which are
specified
in text files, or synthetic (random) ones, which are created using
predefined models. The studied networks can be edited and
displayed
graphically. Results are
stored in text and graphic files.
Analysis of structural and
functional properties of empirical and synthetic trophic networks:
Gauzens B, S Legendre, X Lazzaro & G Lacroix. 2013. Food-web aggregation, methodological and functional issues. Oikos 122:1606–1615.
Jacques
Gignoux, Gérard Lacroix, Xavier Lazzaro, Elisa
Thébault.